QCSchool: Embedding QCTools in an automated digitization workflow

By Peter Bubestinger
As our open-source, video analyzation software, QCTools continues to evolve, we’ve been talking to users around the world about how they use the versatile application in their specialized workflows. Peter Bubestinger is a digital archivist who has worked with many cultural heritage institutions including Austrian Mediathek (Österreichische Mediathek), the country’s national audio/video archive. Peter is a notable contributor and user of QCTools and recently I asked him if he could describe for us how QCTools is used in conjunction with Mediathek’s innovative digitization workflow system, DVA-Profession, for which he also serves as a lead developer. – Kelly Haydon
Austrian Mediathek uses a digitization workflow system called DVA-Profession. Within the system there is a post-capture error analysis task that uses graphs generated by a program called Shotdetect. Shotdetect was not developed for quality control, but for identifying shots and scenes in a video. The description below is from the DVA-Profession manual:
The “analysis graph” offers the operator an opportunity to detect problems of the captured video tape with incredibly high accuracy: all kinds of video artifacts can be detected, ranging from small things like dropouts to the complete break off of a video signal. This demands the operator to engage himself/herself in detail with the analysis graph, to study its “language” and to develop a feeling for those graphs.
The graphs generated by Shotdetect are:
- Quantity of movement: The difference between 2 frames
- RGB colors: The sum of color values in a frame

No Automatic Detection
When showing others how easily certain transfer errors or video artifacts might be spotted using these 2 simple graphs, the first question was: “What about automatic detection?”
We have done direct comparisons with state-of-the-art tools that offer automatic audiovisual artifact detection. These systems are currently still far from perfect. Many artifacts go through undetected because existing algorithms are not powerful enough; they also produce false-positives.
This leads to an interesting situation: Think of crossing a busy intersection with an unreliable traffic light.
When a user relies solely on the automatic detection, some errors will go through unnoticed. If the user is aware of this issue, they will spend the same amount of time checking the material for undetected errors as they would if there was no automatic detection at all.
Automatic detection would be a great thing, but for the time being, it might give users a false feeling of safety and control.
If users are committed to performing quality digitization work, just like with an unreliable traffic light, they will need to stop and look both ways. Unless of course, they just drive on anyway hoping it will be okay.
Replacing Shotdetect with QCTools
Our experiences using Shotdetect gave us valuable insight which was provided back to QCTools developers in form of tickets on the GitHub site. For example, features like jumping to a certain frame were added.
There are several reasons why we would like to replace Shotdetect with QCTools in the future:
- Provides more analysis graphs
- Has a playback window that allows easy investigation of detected artifacts.
- Is a frontend to FFprobe. Since FFprobe is part of DVA-Profession anyway, this reduces the number of application-dependencies.
- Shotdetect is no longer actively maintained by its developer.
Since DVA-Profession’s control interface is browser-based, the intention is to incorporate the analysis graphs into the browser. Therefore it is desired to:
- Already generate analysis data during digitization workflow, so it can be opened in QCTools instantaneously – drawing the graphs without the operator having to wait.
- Generate analysis graphs as images (PNG).
Having the graphs as standalone images not only allows embedding the graphs in the web-browser GUI as a workflow step, but also to store them as metadata in the AIP (archival information package). This way they can be reviewed at any later point in time, without requiring any additional program to visualize the data.
My new company’s Research and Development department has started experimenting with generating PNG images from QCTools’ CSV file, using Gnuplot.
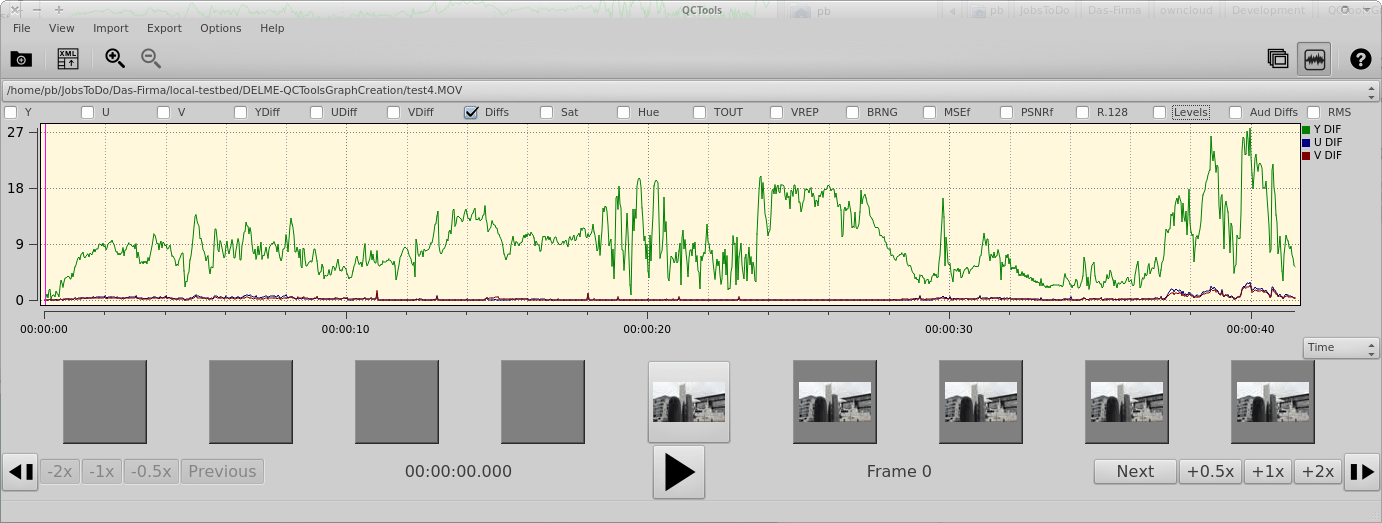
Below you can see “YDiff” graphs of Gnuplot in comparison to QCTools. These are early steps using Gnuplot, and there are still improvements in term of scaling and color, etc. to be done.
But I hope you get the idea.
Gnuplot
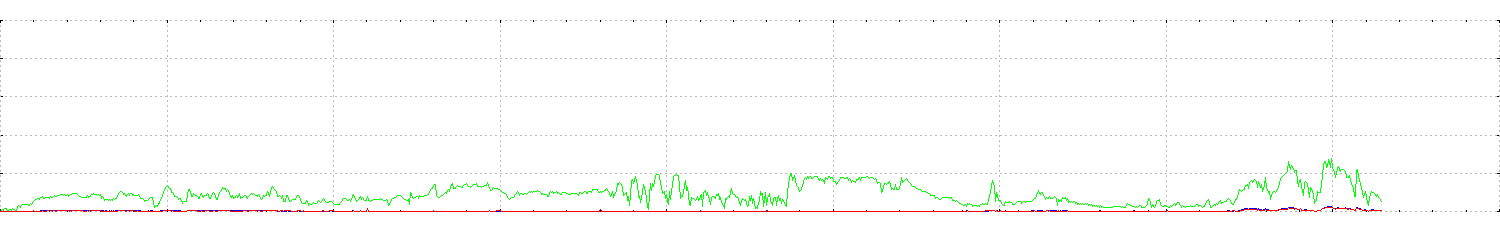
QCTools
Constant resolution. Constant zoom.
When comparing Shotdetect graphs with those in QCTools, the zoom feature plays an important role:
By default the graph resolution is hardcoded in Shotdetect: Each horizontal pixel represents one video frame. Always 400px height. In that case, since there is no frame-between-frames, there is no need to zoom in horizontally, since there is no additional information in the data. (Note: This does not apply to audio – but that is a different case.)
As mentioned before, the vertical resolution/zoom of Shotdetect was also hardcoded to 400px height. QCTools on the other hand, auto-scales the graphs, depending on the current values. This is a nice feature, but having a constant vertical/horizontal zoom is also very desireable.
For example, if the height of the graph`s peaks is fixed, the operator gets a feeling for the “severity” of a peak, as well as some “artefacts” issue only very small peaks in some graphs, which is also a valuable visual clue.
These features have already been posted as wishlist on the QCTools GitHub issue tracker as #29 and #50.
Work in progress…
Turning data gathered from audiovisual material into standalone viewable images is definitely a doable task without artificial restrictions. Yet, there are a number of issues pending:
- The XML files that QCTools produces do not parse well in Gnuplot. A CSV file is much easier and a proper XSLT can transform an XML to a CSV.
- Too many graphs can cause distractions. Depending on the source of the video material, some graphs might be more helpful than others.
- Embedding graph images in the browser allows showing only certain ones. When opening the video in QCTools it would be good to be able to pre-select which graphs – and in which order – they are displayed (Issue #43 on GitHub).
How QCTools is designed: It matters.
QCTools is an awesome QC tool, one that is technically designed to be easy to use for ad-hoc analysis, as well as for proper integration into a fully automated workflow system.
Many thanks to the QCTools’ developers who made sure that additional audio/video feature extraction and video-filters were merged back upstream in FFmpeg. It is a rare example showing how a program can be designed for collaboration and use cases beyond its original intention.
Keep up the good work!