QCSchool: All About TOUT

This post is written by former BAVC Media Presevationist Kelly Haydon
Welcome to our very first how-to blog for QCSchool: A blog series for users of QCTools. Since I’m am the one driving, I get to choose the music, and I’ve decided we’ll start with the filter most analogous to the easy listening instrumentals of The John Tesh Project: TOUT, or, Temporal Outlier.
So why is the TOUT filter so accessible and easy for the novice to grasp? Because unlike other some other filters that will remain unmentioned (for now), a high TOUT value will more often than not lead the user to a bonafide, no-question-about-it video artifact.
The TOUT filter was developed as part of ffmpeg’s signalstats filter family to detect noise in analog VHS and 8mm video, but it has proven useful in identifying any abrupt instance of pixel anomalies – such as those seen in dropouts and other loss-of-signal artifacts – that are common in all digitized analog video formats.
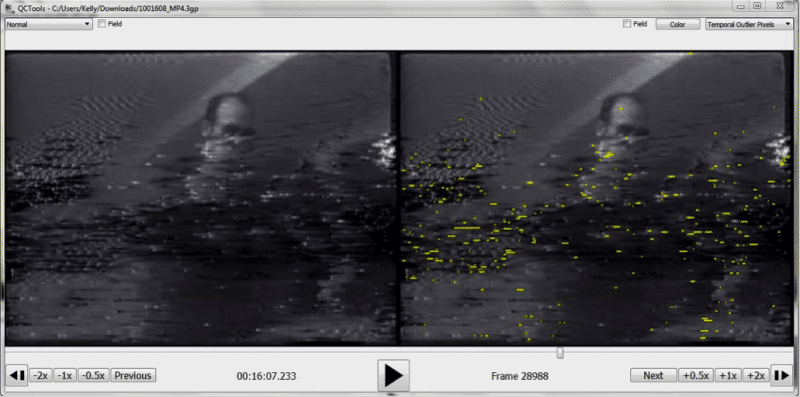
Below is the graphical landscape of a recently found video footage of a young Hunter S. Thompson. A pink line hovers over a noticeable spike that indicates a high TOUT value around the 16 minute mark.
Viewing the frame in a playback window, we can see a big tracking mess, a “crash record” artifact commonly seen in ½” open reel video works when the camera is abruptly turned off then turned back on again.

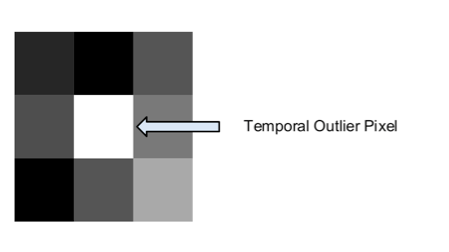
Like most QC Tool filters, TOUT works by establishing an average and reporting on the difference. Spikes or blips seen in the graph mean a pixel has been detected as having a value that is dramatically different than the quadrant of pixels surrounding it. The more pixels in a frame with this difference, the higher the spike.

But wild fluctuations in the values between neighboring pixels do not always point to a significant signal error, in fact they usually don’t. Pixels in small, high contrast areas of an image, such as tiny reflections (the sun glinting in the background, stage lights bouncing off a violinist’s bow), are highlighted by the TOUT filter, as are expected instances of noise, such as at the head and tail of the tape. Aware of these “false positives,” the QC Tools developers have established a metric for identifying those instances outside of a normal range of TOUT pixels: any spike hitting the 0.09 or higher mark is considered a “questionable quality issue.”
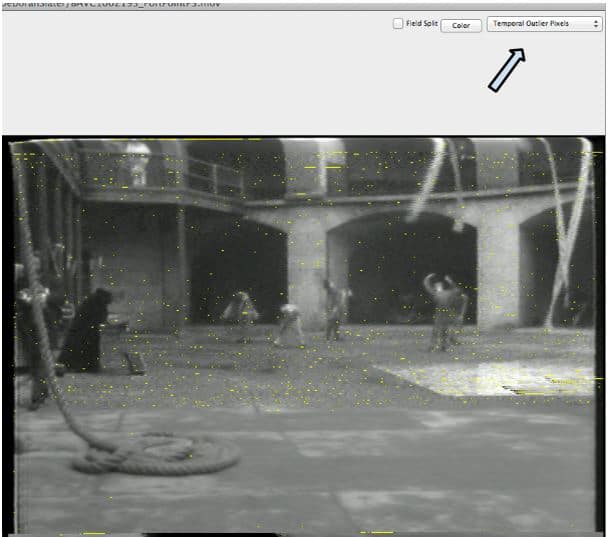
However, lower measurements may still be an indicator of noteworthy damage or error – if they are well above the average appearance of TOUT pixels in the entirety of a digitized work. Take this example of a ½” open reel videotape from the collection of dancer and choreographer, Deborah Slater, recently digitized by BAVC Media as part of our Preservation Access Program. Remarkably clear of the intense dropout activity that characterizes this format, this small spike was noticeable on a largely flat plane:

In the QC Tools viewer, we saw that the part of the tape in which the anomaly occurred turned out to be an abrupt artifact singular only to that frame of video: a band of noise, dropout, and bearding, all possible indicators of an error that occurred during capture (amongst other potentialities too long to go into here).

And there you have it, two examples of what you can find when you use the TOUT filter. How do you use TOUT? Let us know in the comments. And stay on the look out for our next blog, when your friendly preservationist gives you the digs on her favorite filter: MSEF, a mean, mean, mean old square.


